TDD at work
- Selvyn Wright
Introduction
As we stated earlier the ideas behind TDD are nothing new and in actual fact date back some 30 years but it's the application of the concept that's different. So in this brief session I'm going to walk you through a little problem relating to timesheet management.
Problem
Open the following document, it contains the case study.
The scenario is as follows -
A small company has been using an excel type application to capture timesheet data for quite some time giving rise to a number of obscure reporting and output formats for the time fields. They have a plan to move to a COTS product but need to import all the all data from the existing system. At some point the data will be exported out of the original application an imported into the COTS product. The COTS product expects the data to be correct and in the correct format – time entries must be in 24hr format, hourly rate (we call this normalized or European time format), hours worked and pay must be in a decimal format of two decimal points.
Unfortunately, the organization no longer has access to the original code base that was used to create the custom timesheet application and the only fields that are present are – Check In Time, Check Out Time and Hourly Rate. The Hours Worked and Pay must be calculated using a small transformation application that will be written in Java.
- The amount to be paid = (hours + minutes worked) * hourly rate
- The check in time and check out time must be specified. These times must be specified in the following format HH:MM [<AM|PM>], if AM|PM are not specified AM is assumed, otherwise 24hr notation may be used or any combination.
- The hourly rate is a decimal value
- The hours worked should be as a decimal value
You will not be responsible for the extrating of the data from the legacy system only the correcting and formatting of the times and, calculating the hours worked and how much they should be paid
Acceptance Criteria Statements
A popular way of determining the input and output values for a system is to use an expressive technique used by the folks working with Cucumber and Gherkin
- Given <pre-condition>
- When <the trigger>
- Then <post-condition>
Essentially the Given and Then become pre and post conditions respectively.
So our timesheet example can be expressed as follows
- Given the check in time, check out time and the hourly rate
- When the check in and checkout times have been normalized
- Then calculate the hours worked and the pay
Let's create an example
- Given check in time of 9:00AM, checkout time of 5:00PM and hourly rate of £7
- When 9:00AM and 5:00PM have been normalized to 0900 and 1700 respectively
- Then the hours worked will be 8 hours and the pay is £56.00
Given, When and Then can be derived directly from your use cases or stories. In actual fact if you examine the data values above you will surmise that this data is actually the data values that would be present if you were to detail a scenario for a use case.
Specification by example
Another way of representing input and output values for a test would be to use a simple table. One set of columns representing the input values and another set of columns representing the expected output values. we mark the output columns with a question mark ![]() or a different colour to the input columns. This way of representing input and output values is also called specification by example. Using such a technique makes it very easy for non technical users to specify. It means that this tool can be used in a collaborative environment (clients, users, designers, architects and developers).
or a different colour to the input columns. This way of representing input and output values is also called specification by example. Using such a technique makes it very easy for non technical users to specify. It means that this tool can be used in a collaborative environment (clients, users, designers, architects and developers).
Let's create a series of test scenarios (each row is a scenario) using an example of specification by example
Check in time | Check out time | Hourly rate | Check In Time Normalised? | Check out time Nornalised? | Hours worked? | Pay? |
9:00 AM | 5:00 PM | 7 | 09:00 | 17:00 | 8.00 | 56.00 |
10:30 AM | 12:30PM | 4 | 10:30 | 12:30 | 2.00 | 8.00 |
9:45AM | 12:45 PM | 10 | 09:45 | 12:45 | 3.00 | 30.00 |
9:30 AM | 12:15 | 10 | 09:30 | 12:15 | 2.75 | 27.50 |
9:30 | 12:15 PM | 10 | 09:30 | 12:15 | 2.75 | 27.50 |
09:00 AM | 15:00 | 8 | 09:00 | 15:00 | 6.00 | 48.00 |
09:00 | 3:00 PM | 8 | 09:00 | 15:00 | 6:00 | 48.00 |
9:05 PM | 3:30 PM | 7 | 09:05 | 15:30 | ERROR | NIL |
How many scenarios should I specify?
That's a really difficult question to answer. But let me try! I would start by saying the criticality of the application would be a major driver. I'm going to divide the world into two groups criticality and complexity. I'm using criticality as a measure of importance and value to the organization. I'm using complexity as a measure of how difficult it will be to implement/realize the use case/story for which the scenarios are related.
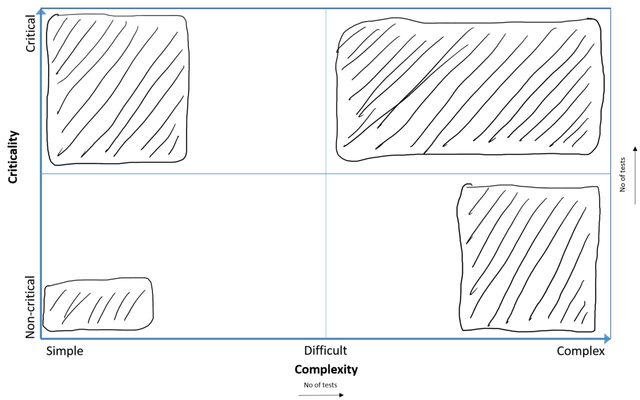
How to read the graph
Each quadrant represents a level a complexity and criticality.
The criticality axis goes from none to critical. It is divided into two portions, the mid point being 50%. The graph is saying that if the requirements could be considered non-critical and the solution is considered to be simple, then there is a strong argument for deciding on a low number of tests, but if the complexity of the solution moves towards complex then the need for more tests would increase. If the requirements could be considered critical, then the need for tests is already high. A move towards complex on the complexity axis would simply increase the need for more tests.
The complexity axis goes from simple to complex, the mid point, difficult being 50%. The graph then says that if the requirements are such that on analysis you deem the solution to be simple and the criticality leans towards non-critical, then there is a strong argument for deciding on a low number of tests, but if the criticality moves towards critical then the driver for more tests would increase. If the solution to the requirements is considered to be complex then the need for test is already high. A move towards critical on the criticality axis would simply increase the need for more tests.
The graph is also trying to depict the fact that each quadrant can be graphed independently of the other quadrants.
Working with FitNesse
Before getting into the details of FitNesse pages let's talk about FitNesse and what it will do for you. One of the problems with you using unit testing tools like JUnit or NUnit is that non-developers cannot actively write and drive the tests. The tests for the tools have to be written in the programming languages that those tools were designed for, JUnit for Java and NUnit for .Net languages. In reality, in a TDD environment especially in an acceptance testing environment) the person(s) writing the tests won't solely be developers but people from the business and business analysts. FitNesse allows tests to be written in a language and programming agnostic manner.
The essential architecture is shown here